Happy holidays, ABCbyD community, and aloha from the island of Hawaii. Last week, I promised an evaluation of the MITRE ER6 results, and I’m excited to bring you (at least part of) that analysis today. Today’s write-up is the result of several hours of work and more math than I’d care to admit.
This year’s evaluations spanned three scenarios: DPRK, CL0P, and LockBit. Today, we will focus on the LockBit scenario, which emulates ransomware tactics emblematic of one of the most prolific and destructive ransomware families.
I decided to focus on the LockBit scenario with the methodology for this week’s analysis being:
Identify relevant statistics related to detecting LockBit
Assess vendor detection configuration: out-of-the-box detections, configuration changes, and false positives
Attempt to stack rank vendor performance in a way that is easy to understand and (as best I could) remain unbiased.
Let’s dig in!
Why Focus on LockBit?
Ransomware as a service is on the rise, and LockBit represents the archetype of modern ransomware: stealthy, sophisticated, and relentlessly opportunistic. By emulating its tactics, techniques, and procedures (TTPs), MITRE provides organizations with an invaluable opportunity to evaluate how well endpoint detection and response (EDR) solutions hold up against one of today’s most pressing threats. This seemed the most straightforward in terms of cut-and-dry assessments, especially since most EDR vendors promote their ransomware effectiveness.
Setting the Stage: The MITRE ER6 LockBit Scenario
MITRE thoughtfully provides a DIY setup for those interested in replicating the LockBit scenario. The virtual environment, detailed on MITRE’s GitHub page, includes endpoint systems running Windows, Linux, and macOS. This multi-platform approach reflects the complexity of real-world environments where ransomware doesn’t discriminate.
MITRE breaks down vendor performance across three categories:
Detection: Specificity of alerts, ranging from generic detections to detailed, step-specific alerts.
False Positives: Unnecessary noise generated by the solution.
Protections: The ability to proactively block or mitigate the threat.
With 19 vendors participating, the challenge lies in determining how to compare results effectively and distill insights into actionable information.
Vendor Performance: A Snapshot
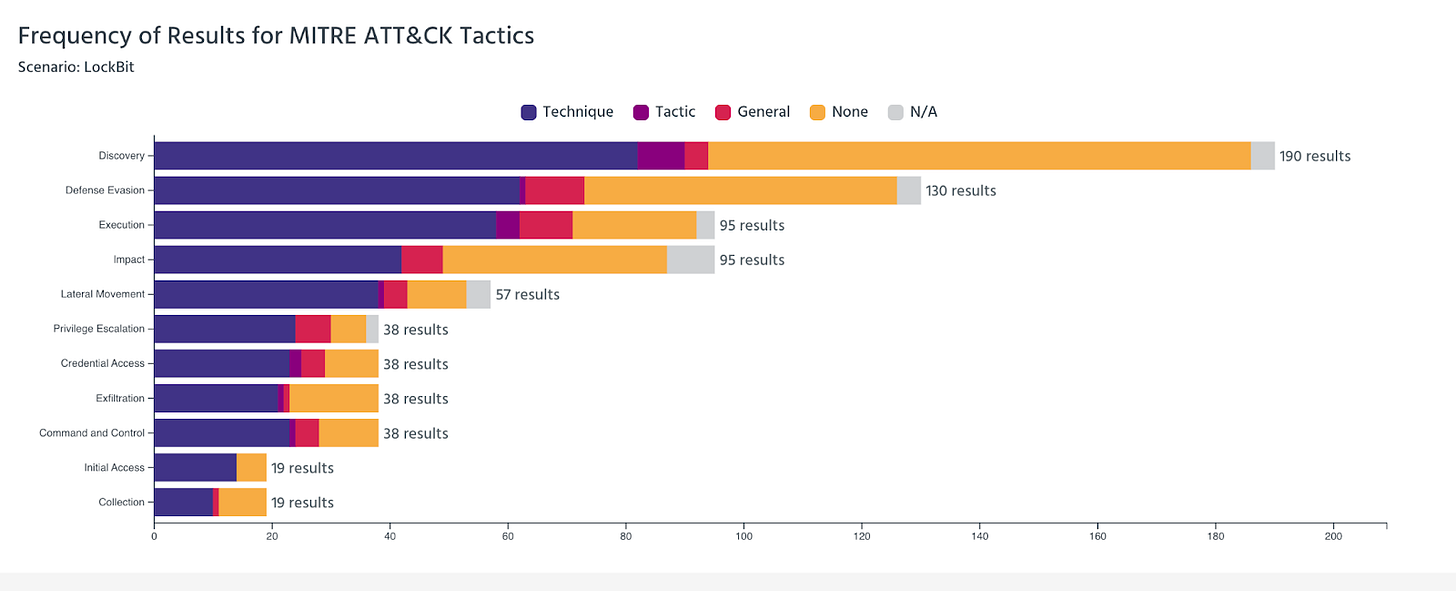
For context, here’s how everyone stack-ranked across the associated Tactics in this scenario:
A few things jumped out to me immediately when I saw this graph (note that this is for the LockBit scenario…when you jump to evaluations results there are a few different selections you can make).
While this is a composite review of all vendors who participated across the various tactics, there were greater gaps than I expected. It’s clear that defense evasion and discovery provide the greatest area for opportunity across vendors, but perhaps there’s a future analysis of a broader gap analysis. If you’re interested, please let me know in the comments!
Going one layer deeper, I navigated to the individual vendor evals page, which lets you review and compare up to three vendors side by side. Compiling a few separate data points, I focused on the key metrics highlighted by MITRE: false positives, detections (by category), number of alerts, and configuration changes.
Here’s how the 19 participants stacked up:
If your eyebrows raised at a few of these numbers (you are reading the Qualys numbers correctly), believe me mine did too. While it’s great to know that organizations can detect threats, 40 techniques were a part of this evaluation.
Going one level deeper, I created a “detectability score” highlighting which vendors provided out-of-the-box detectability as opposed to those who required configuration changes.
Detectability = (total alerts - configuration changes)/configuration changes
Why specify detectability? Out-of-the-box configurations required a great deal of fine-tuning to identify malicious behavior. One of the most common misrepresentations in previous evaluations is when vendors claim to detect adversarial activity and gloss over the fine-tuning required to do so. Consider this color-coded spreadsheet your “report card at-a-glance.” If you need to do a ton of tuning, ask yourself if the capability you are considering is worth the investment you and your team will need to invest to be successful.
Ranking Vendors: A Signal-to-Noise Approach
If you’ve been following this blog for a while, you know I love to explore ratios and (mildly) algorithmic views of data. Here, we’re using an approach I call the Signal-to-Noise Ratio (SNR), which helps us understand the efficiency of a vendor’s detections.
High SNR means the vendor generates valid detections without overwhelming analysts with noise. It’s important to note we want this number to be as close to 1 as possible. If greater than 1, it can be good, but it also may mean that a level of depth is missing on detections provided.
SNR = Valid Detections / (False Positives + Missed Detections + Total Alerts)
Here are a few cherrypicked results:
BitDefender: 6.5
Cisco: 0.00282
Cynet: 0.025
Microsoft: 0.088
Palo Alto: 0.204
Top Performers
Microsoft: Outstanding detection accuracy and minimal configuration changes.
Cynet: High signal fidelity with no false positives and manageable alert volume.
Palo Alto Networks: Reliable out-of-the-box performance with minimal noise.
Honorable Mentions
Bitdefender: Low false positives and compact alert volume, though one missed detection slightly impacted its rank.
HarfangLabs: Balanced detection capabilities with no noise, suitable for mid-sized organizations.
Needs Improvement
Vendors such as Qualys and Cisco produced excessive alerts, which, while comprehensive, risk overwhelming security teams. Effective deployment of these solutions likely requires significant fine-tuning.
I was a bit perplexed and taken aback by the results of this analysis, while Qualys and Cisco could detect activity, I find it hard to believe that anyone would want to pore through thousands of alerts to determine the validity of an attack.
A New Metric: Weighted Composite Scoring
While I was happy with a ratio, I realize that the variance in results was higher than expected, and if we’re trying to rank vendor performance, it would behoove us to normalize as best we can.
Enter a Weighted Composite Score to evaluate vendors more holistically. This score combines:
Detection Coverage (50%)
False Positives (20%)
Missed Detections (20%)
Configuration Changes (10%)
If you’d like to run this yourself, here’s the formula:
Composite Score = (W1 × Dc) + (W2 × (1 - Fp)) + (W3 × (1 - Md)) + (W4 × (1 - (Cc / At)))
Where:
W1, W2, W3, W4 = Weights assigned to each metric (e.g., Detection Coverage, False Positives, Missed Detections, Configuration Changes). These are expressed as proportions that sum to 1 (e.g., W1 = 0.5, W2 = 0.2, W3 = 0.2, W4 = 0.1).
Dc = Detection Coverage (proportion of techniques detected, normalized between 0 and 1).
Fp = False Positives (normalized, where 1 - Fp rewards lower false positives).
Md = Missed Detections (normalized, where 1 - Md rewards fewer missed detections).
Cc = Configuration Changes (number of configuration changes required).
At = Total Alerts generated.
1 - (Cc / At) = Configuration Efficiency (penalizes excessive configuration changes relative to total alerts).
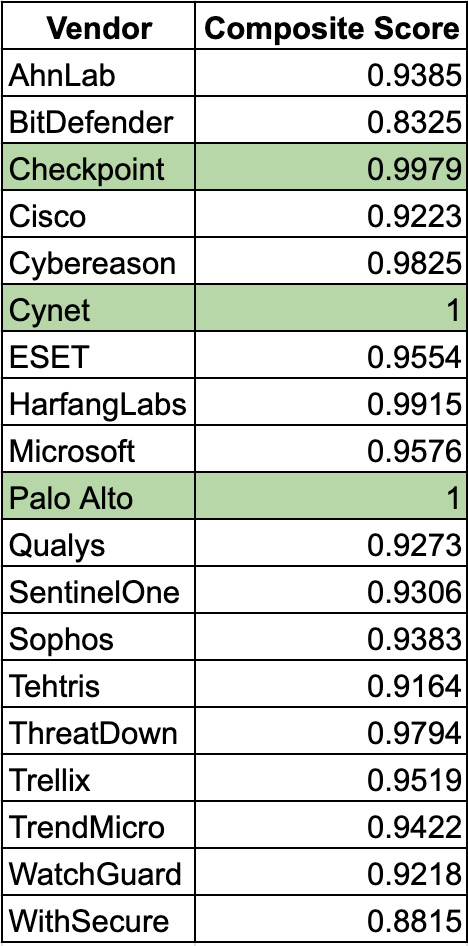
Running the numbers, here’s a list of vendors with their normalized composite scores.
Great! We were able to normalize the data. Several vendors (Cynet, Palo Alto) achieve a perfect or near-perfect composite score under these weights, primarily because they:
Detected all techniques (no misses).
Had zero false positives.
Required zero configuration changes.
Vendors with extremely large alert counts tend to score well on the (1−Fp) term if they had very few false positives in proportion to those alerts.
If a vendor had some configuration changes but also a high number of alerts might still remain relatively high (depending on that ratio).
I’ll be the first to admit, as soon as we normalize or adjust, we introduce bias into the data. Point being, Checkpoint’s number of alerts (575) is almost three times that of Palo Alto Networks, yet they finish in the top 3 of this approach.
What do these analyses tell us?
So a few different strategies and some normalization later, we can see the LockBit scenario reveals interesting insights about vendor performance:
Palo Alto Networks and Cynet emerged as clear leaders with high detection rates, zero missed detections, and minimal noise.
BitDefender achieved high efficiency, with low alerts and a competitive detection-to-noise ratio.
Microsoft delivered reliable results, balancing cross-platform coverage with manageable noise.
Vendors like Cisco and Qualys generated excessive alerts, which could hinder analysts' ability to act quickly during a live attack.
So, Who Won the LockBit Scenario?
If we’re strictly looking at signal-to-noise, BitDefender takes the lead with an impressive SNR of 6.5. However, an SNR of greater than 1 may not always be a good thing.
When we factor in holistic performance through Weighted Composite Scoring, Cynet and Palo Alto Networks emerge as the top contenders. They combine strong detection with minimal configuration changes and noise.
Ultimately, the “winner” depends on your organization’s priorities:
If efficiency is paramount: Go with BitDefender.
If you want robust detection with minimal tuning: Palo Alto or Cynet.
If breadth of coverage is your focus: Microsoft remains a strong choice.
Key Takeaways for Security Leaders:
Ransomware Detection Is Non-Negotiable: The LockBit scenario underscores the predominant role ransomware has played as a threat vector, highlighting the importance of tools that detect pre-positioning activities like lateral movement and privilege escalation.
Signal Over Noise: High detection rates mean little if analysts are drowning in alerts—balance matters.
Customization vs. Out-of-the-Box: Evaluate the trade-offs between immediate efficacy and the need for tuning. Tools requiring excessive configuration may not scale well in dynamic environments.
What’s Next?
After the holidays, we’ll shift gears to macOS threat detection and hunting. We'll examine the DPRK evaluation and some other macOS threat hunting exercises.
I hope you all have a safe, healthy, and enjoyable Holiday!
Stay curious and stay secure, my friends.
Damien
Note: These are my opinions only. I do not support or discourage investment in security vendors. If you would like a CSV of any of the analyses run for your own independent analysis, please let me know in the comments!


